The homepage is displayed in the following Fig 1-1:
1. Main functions of the database are provided in menu bar form (boxed in red).
2. Other databases contributed by our group.
3. Cite information.
4. Resources integrated in PDR.
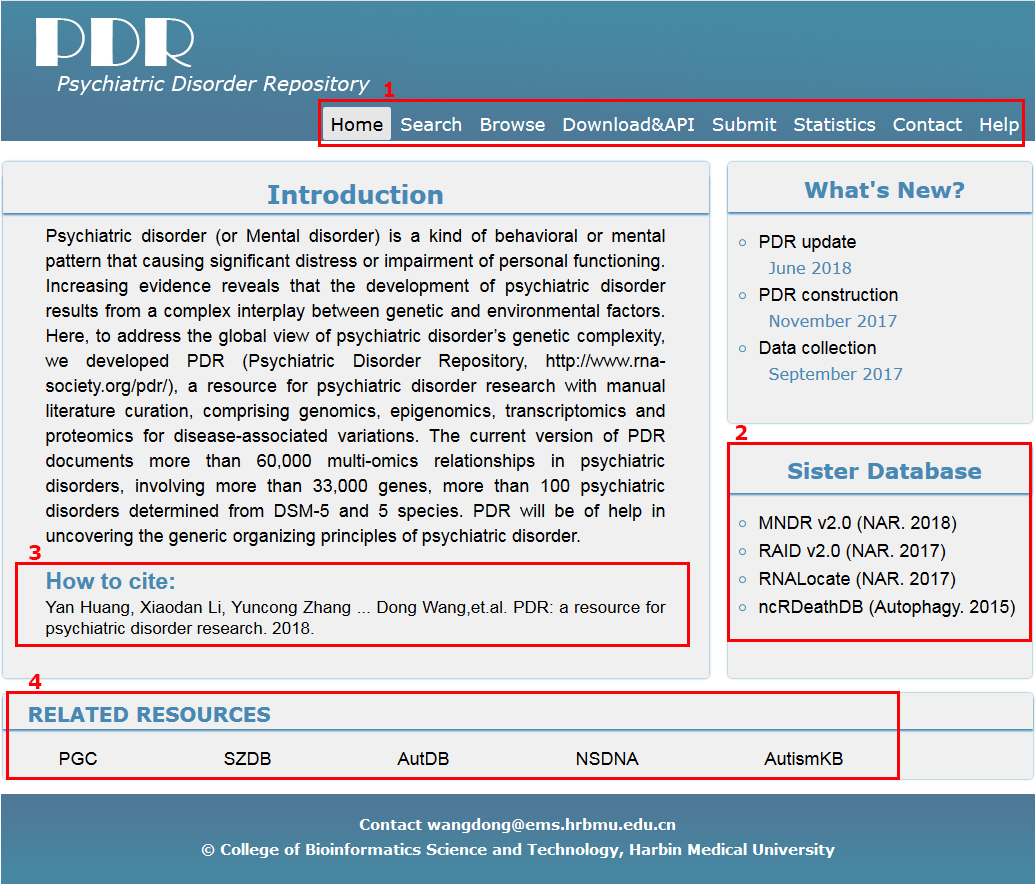
Fig 1-1 Home page
The search page is displayed in Fig 2-1:
1. Select target omics: Four choices are provided.
2. Enter multi-keywords corresponding to selected dataset.
3. We always search the keyword in a fuzzy pattern.
4. Example for 'Keywords Search'.
5. Before you search, you should read the 'Note'.
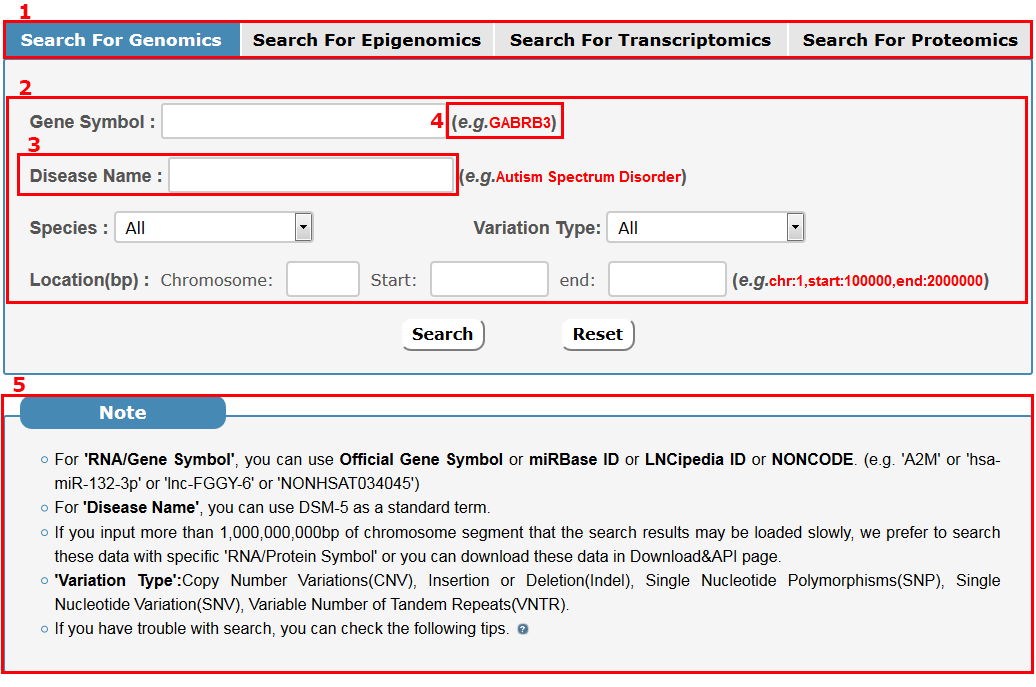
Fig 2-1 Search page
In the browse page, you can click each node to see results:
1. 'Diseases(DSM-5)' displayed all entries as long as the current selected disease is involved.
2. 'Species' displayed all entries as long as one molecule's organism matches the condition.
3. 'Omics' indicates all kinds of omics in PDR.
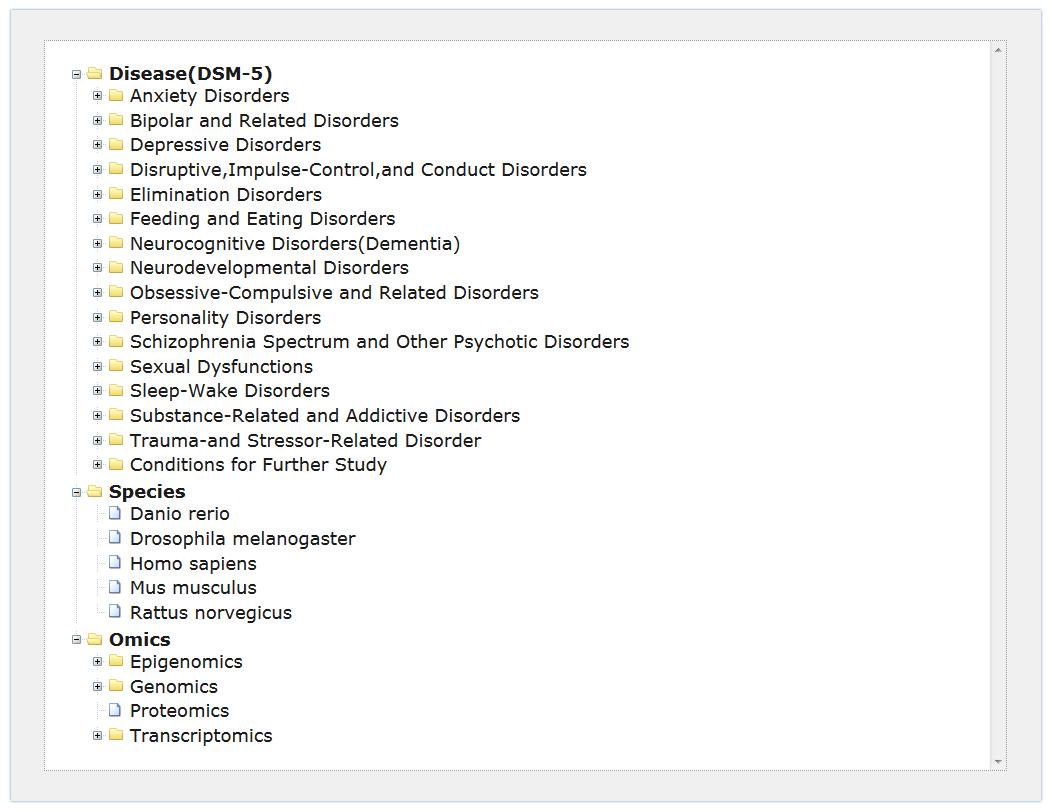
Fig 3-1 Browse page
Search results
For genomics search results, all entries are listed with basic information including gene symbols, species, variation type, sample type and disease name, see Fig 4-1:
1. Click 'Download' to get a .txt file for your search results.
2. Click 'more' to get the detail information about this entry.
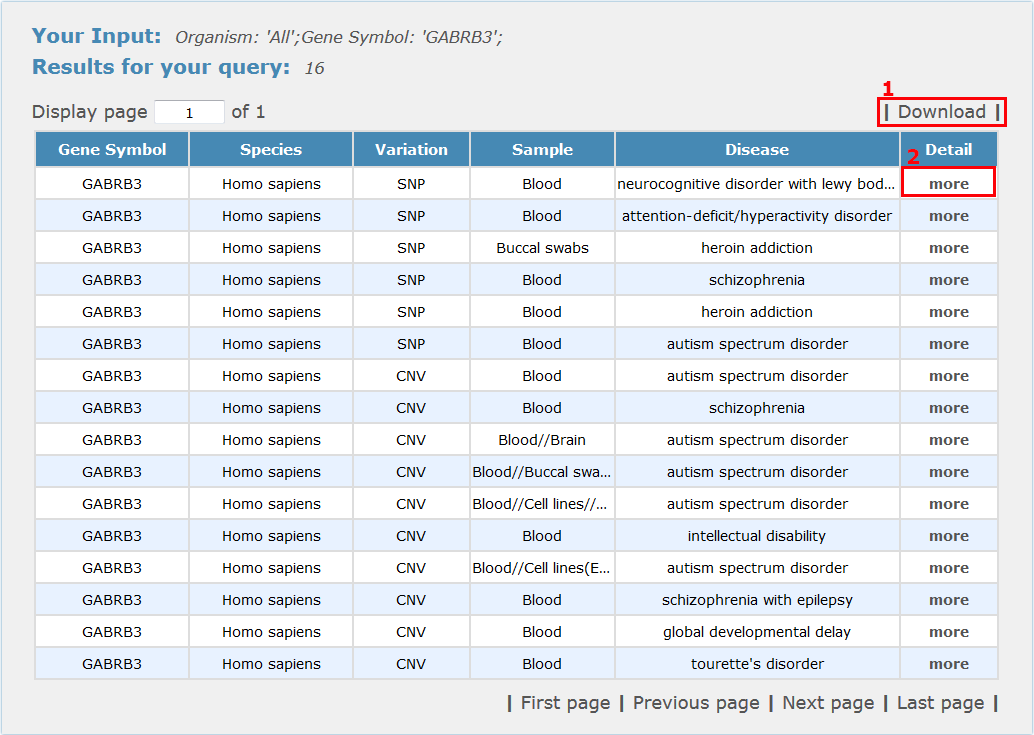
Fig 4-1 Genomics results page
For epigenomics search results, all entries are listed with basic information including gene symbols, species, epigenetic variation, sample type and disease name, see Fig 4-2:
1. Click 'Download' to get a .txt file for your search results.
2. Click 'more' to get the detail information about this entry.
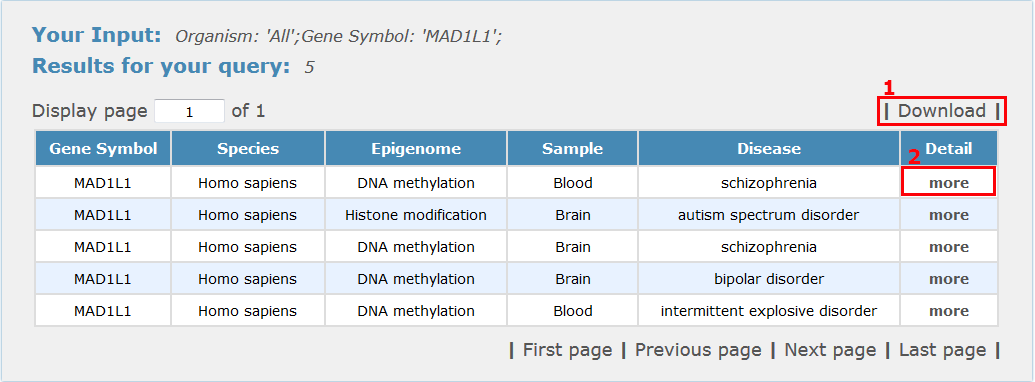
Fig 4-2 Epigenomics results page
For transcriptomics search results, all entries are listed with basic information including gene symbols, species, RNA category, sample type and disease name, see Fig 4-3:
1. Click 'Download' to get a .txt file for your search results.
2. Click 'more' to get the detail information about this entry.
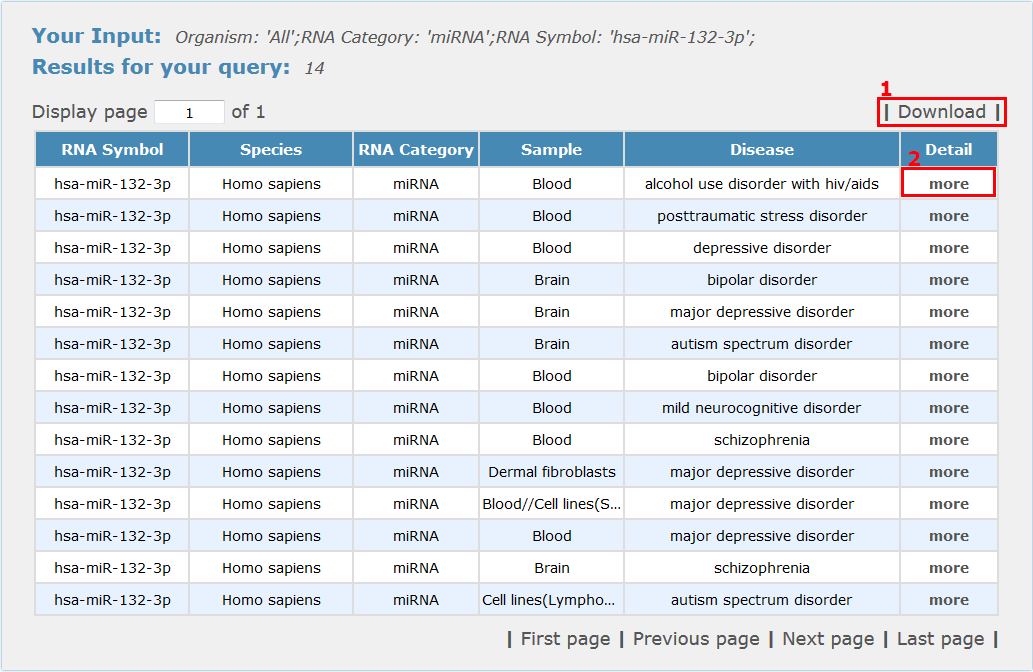
Fig 4-3 Transcriptomics results page
For proteome search results, all entries are listed with basic information including gene symbols, species, sample type and disease name, see Fig 4-4:
1. Click 'Download' to get a .txt file for your search results.
2. Click 'more' to get the detail information about this entry.
Fig 4-4 Proteomics results page
Browse results
For disease browse results, for example, all entries are listed with basic information including gene symbols, species, sample type, disease name and classification, see Fig 4-5:
1. Click 'Download' to get a .txt file for your browse results.
2. Click 'more' to get the detail information about this entry.
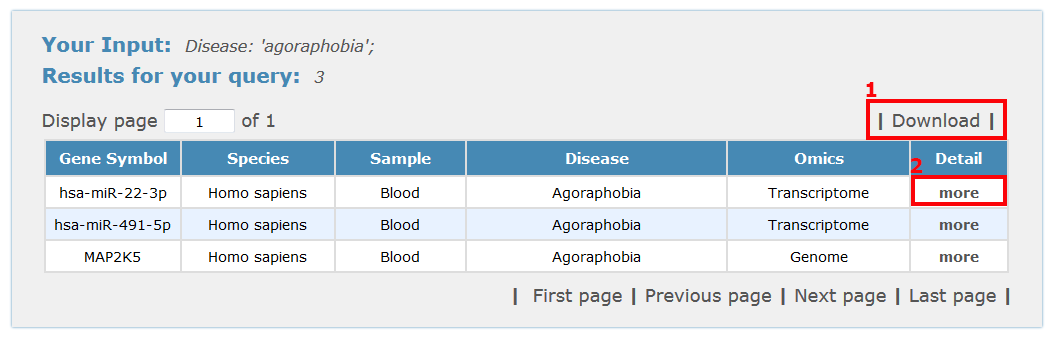
Fig 4-5 Browse results page
In the detail page, you can get information including gene basic information, gene related multi-omics evidence support and references.
I. Gene basic information in Fig 5-1:
Basic information about a gene includes gene symbol, full names, gene type, species, direct links to a few other useful databases and alias.
1. Click Gene symbol, Species, HGNC ID or Ensembl ID to see its basic description in related database respectively.
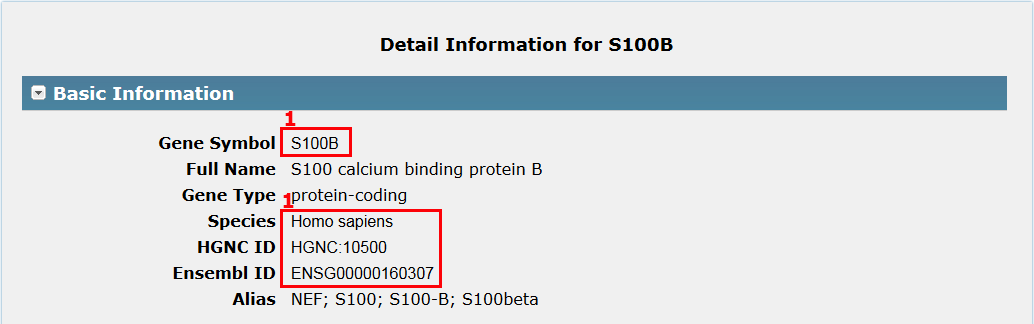
Fig 5-1 Detail page
II. For this region, for example ‘Genomics studies’, it displays studies involved in genomics group, which depending on your previous choice of omics in Fig 2-1, see Fig 5-2:
1.Click here to get the more information about the entry in Fig 5-2.
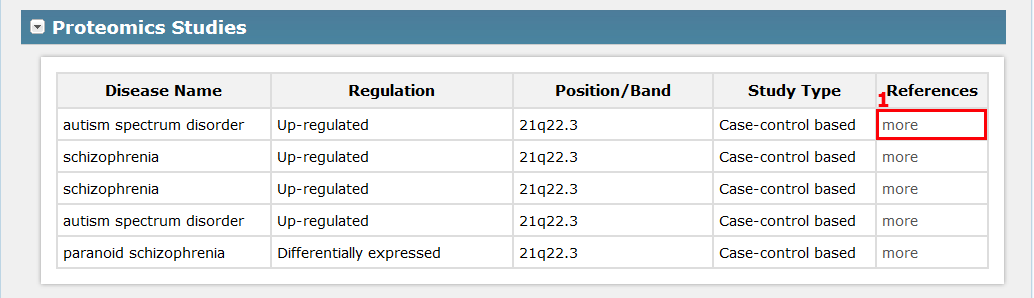
Fig 5-2 Detail page
Fig 5-3:
1.Click here to see its basic description in NCBI database.
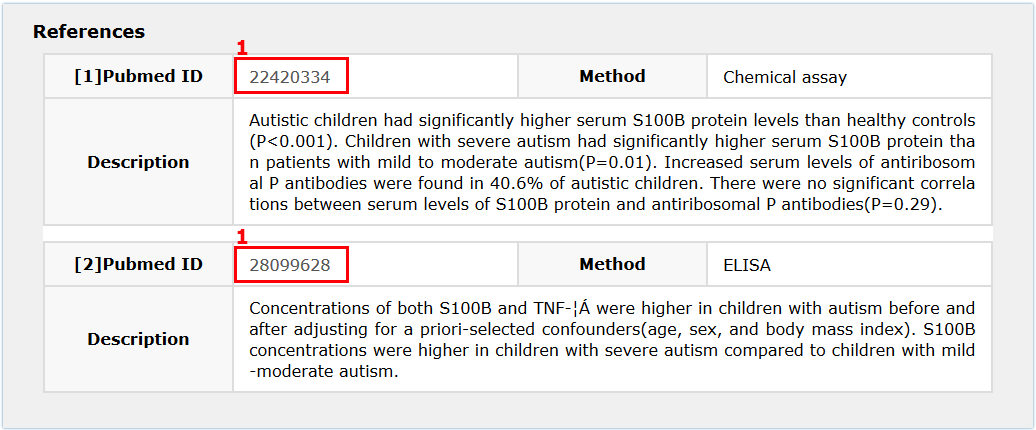
Fig 5-3 References page
III. For Others Multi-omics Studies, it displays studies involved in other omics related to the gene in Fig 5-1, see Fig 5-4:
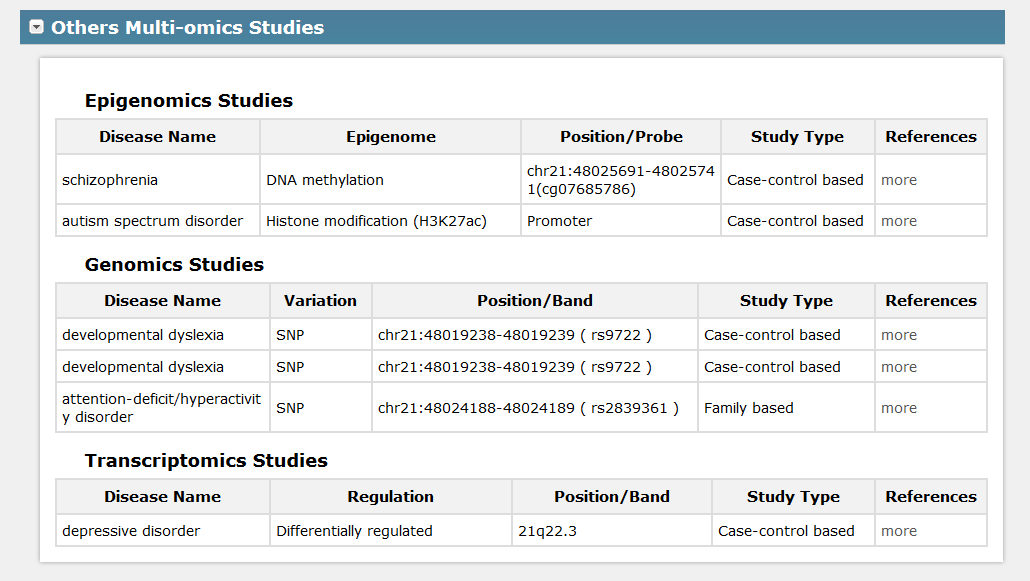
Fig 5-4 Detail page
PDR invites users to upload novel data.
1. ' * ' Denotes a required field.
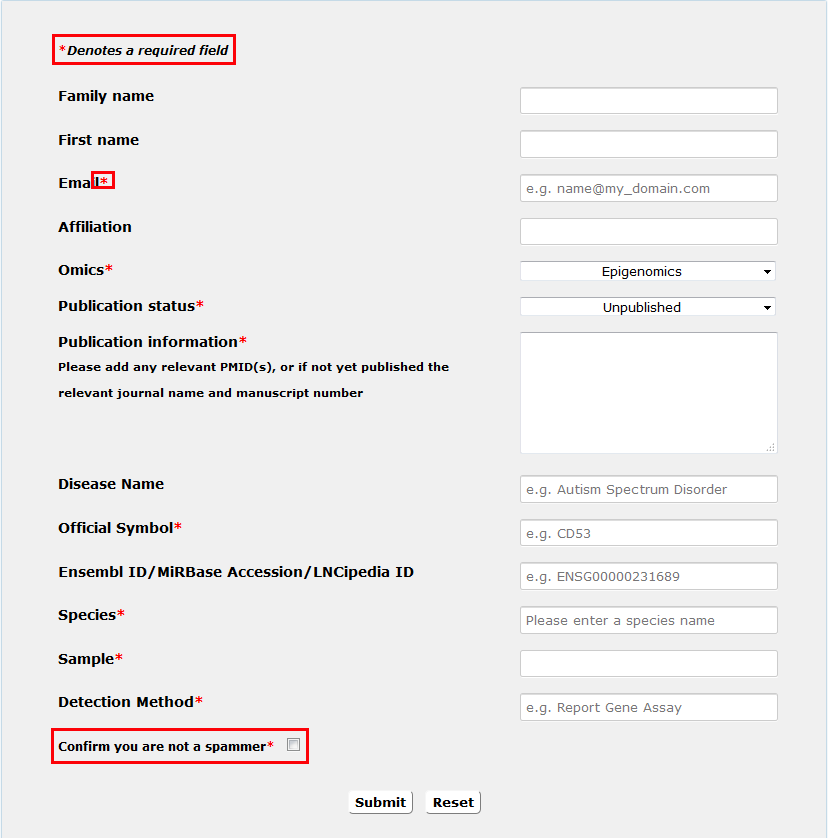
Fig 6-1 Submit page
Integration of source databases which use different gene/RNA/protein and disease naming conventions is challenging. To ensure maximal connectivity of data, we transform each gene/RNA/protein and disease name found in the input sources to the appropriate naming convention.
1. For miRNA, we use miRBase ID and miRBase Accession.
2. For lncRNA, we use LNCipedia ID and NONCODE ID.
3. For others, we use official Gene Symbol and Ensembl ID.
4. For diseases, we normalized each disease name according to DSM-5.
5. For species, we normalized organism names according to NCBI Taxonomy Database.